Coating Uniformity: Advanced Profiling, Defect Mapping, and Process Capability Analysis
Advanced profiling goes beyond the average thickness and standard deviation; it involves a detailed analysis of the thickness profile's shape and its evolution over time. The profile can be decomposed into components: the average level, the tilt (linear slope from edge to edge), the bow (parabolic curvature), and the higher-order waves. Each component has a physical cause: tilt is often due to die misalignment or uneven roll pressure; bow is due to roll deflection or manifold imbalance; higher-order waves may be due to shim wrinkles or local die damage. By fitting a polynomial or using Fourier decomposition, the profile can be characterized by coefficients. The control system can then target each component individually. For example, the tilt can be corrected by adjusting the die's angle or the roll's crown; the bow can be corrected by modifying the manifold or using a profiled shim; the high-frequency waves require local polishing or shim replacement. This component-based approach is more effective than adjusting the average only, because it directly addresses the root cause. In modern lines, the software automatically fits the profile and suggests corrective actions. The operator can also compare the profile to historical data to detect gradual changes, such as die wear or thermal drift, before they become significant. This predictive maintenance aspect of profiling is valuable.
Defect mapping is another powerful tool. Coating defects (streaks, pinholes, edge bead, mottling) often have a spatial correlation with the thickness profile. For example, a thick streak is almost always associated with a scratch on the die lip; a pinhole cluster may correspond to a bubble source. By overlaying the defect map (from an inline vision system) with the thickness profile, the operator can identify the exact location and cause. The defect map can be created by a line-scan camera that captures the web at high resolution; the images are processed by a defect detection algorithm that classifies defects by type and size. The coordinates of each defect are recorded along with the web length. When the operator sees a repeat of the same defect at the same transverse position, they can inspect the corresponding die lip or roll surface. This systematic correlation dramatically reduces troubleshooting time. Also, the defect density can be plotted against the thickness variation to find a correlation; if a thinner region has more pinholes, it may indicate poor wetting at that location. The data from defect mapping can also be used for statistical analysis, such as calculating the defects per unit area and monitoring trends. This is a key component of quality management systems like ISO 9001 and IATF 16949.
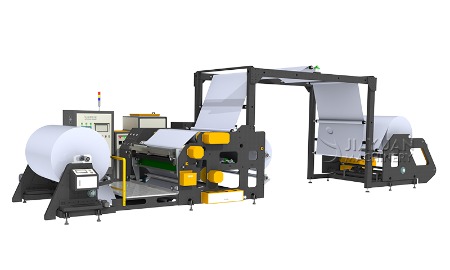
Adhesive coating machine
Process capability analysis is essential for uniformity assessment. The Cpk index, as defined earlier, measures how well the process fits within the specification limits. For uniformity, the specification limits are usually symmetrical around the target (e.g., target ± 2%). The process mean and standard deviation are estimated from a sufficiently large sample (at least 100 measurements). A Cpk > 1.33 indicates a capable process; > 1.67 is excellent; < 1.0 is inadequate. However, Cpk alone does not capture the shape of the profile; it only considers the overall distribution. If the profile is flat but has a high standard deviation due to noise, Cpk will be low. Conversely, if the profile is tilted but the overall distribution is narrow, Cpk may be high, but the product at one edge is off-spec. Therefore, a combined metric is often used: the "profile flatness" (peak-to-peak variation) plus the Cpk for the average. The flatness should be within the tolerance band. Additionally, the "range" (maximum - minimum) of the profile is a simple indicator of uniformity. A good target is a flatness less than 50% of the tolerance. For example, if the tolerance is ±2%, the flatness should be <2% peak-to-peak. This ensures that even the extremes are within spec. Many customers require both Cpk and flatness data in the quality report.
Statistical process control (SPC) charts are used to monitor uniformity in real-time. The scanning gauge provides a profile at regular intervals (e.g., every 10 meters). For each profile, the average, standard deviation, and flatness are calculated and plotted on X-bar and R charts (or I-MR charts). The control limits are set based on the process capability under stable conditions. If a point falls outside the control limits, an out-of-control signal triggers a search for assignable causes. The charts also detect trends, such as a gradual increase in standard deviation, which may indicate die wear or fluid degradation. Operators are trained to respond to these signals according to a predefined action plan. Additionally, the profile can be monitored using a "hot spot" map, where each zone across the width is color-coded by thickness; any red zone (outside the band) prompts immediate investigation. The use of SPC reduces the need for offline quality checks and allows real-time correction, minimizing scrap. The SPC data is stored in a database for long-term analysis, enabling continuous improvement initiatives. In summary,
coating uniformity is not just a physical attribute; it is a statistical entity that requires rigorous measurement, analysis, and control. By employing advanced profiling, defect mapping, process capability indices, and SPC, coating lines can achieve and sustain a high level of uniformity, ensuring consistent product quality and customer satisfaction. This data-driven approach is the hallmark of world-class coating operations, and it is increasingly becoming a requirement for suppliers to high-tech industries such as automotive electronics and medical devices.